23 Cross-validation of training data
Configurations to run this chapter
# load "pysits" library
from pysits import *
23.1 Introduction
Cross-validation is a technique to estimate the inherent prediction error of a model [1]. Since cross-validation uses only the training samples, its results are not accuracy measures unless the samples have been carefully collected to represent the diversity of possible occurrences of classes in the study area [2]. In practice, when working in large areas, it is hard to obtain random stratified samples which cover the different variations in land classes associated with the ecosystems of the study area. Thus, cross-validation should be taken as a measure of model performance on the training data and not an estimate of overall map accuracy.
Cross-validation uses part of the available samples to fit the classification model and a different part to test it. The k-fold validation method splits the data into \(k\) partitions with approximately the same size and proceeds by fitting the model and testing it \(k\) times. At each step, we take one distinct partition for the test and the remaining \({k-1}\) for training the model and calculate its prediction error for classifying the test partition. A simple average gives us an estimation of the expected prediction error. The recommended choices of \(k\) are \(5\) or \(10\) [1].
23.2 Using k-fold validation in SITS
sits_kfold_validate() supports k-fold validation in sits. The result is the confusion matrix and the accuracy statistics (overall and by class). In the examples below, we use multiprocessing to speed up the results. The parameters of sits_kfold_validate are:
-
samples: training samples organized as a time series tibble; -
folds: number of folds, or how many times to split the data (default = 5); -
ml_method: ML/DL method to be used for the validation (default = Random Forest); -
multicores: number of cores to be used for parallel processing (default = 2).
Below we show an example of cross-validation on the samples_matogrosso_mod13q1 dataset.
rfor_validate_mt <- sits_kfold_validate(
    samples = samples_matogrosso_mod13q1,
    folds = 5,
    ml_method = sits_rfor(),
    multicores = 5
)
# plot the confusion matrix
plot(rfor_validate_mt, type = "confusion_matrix")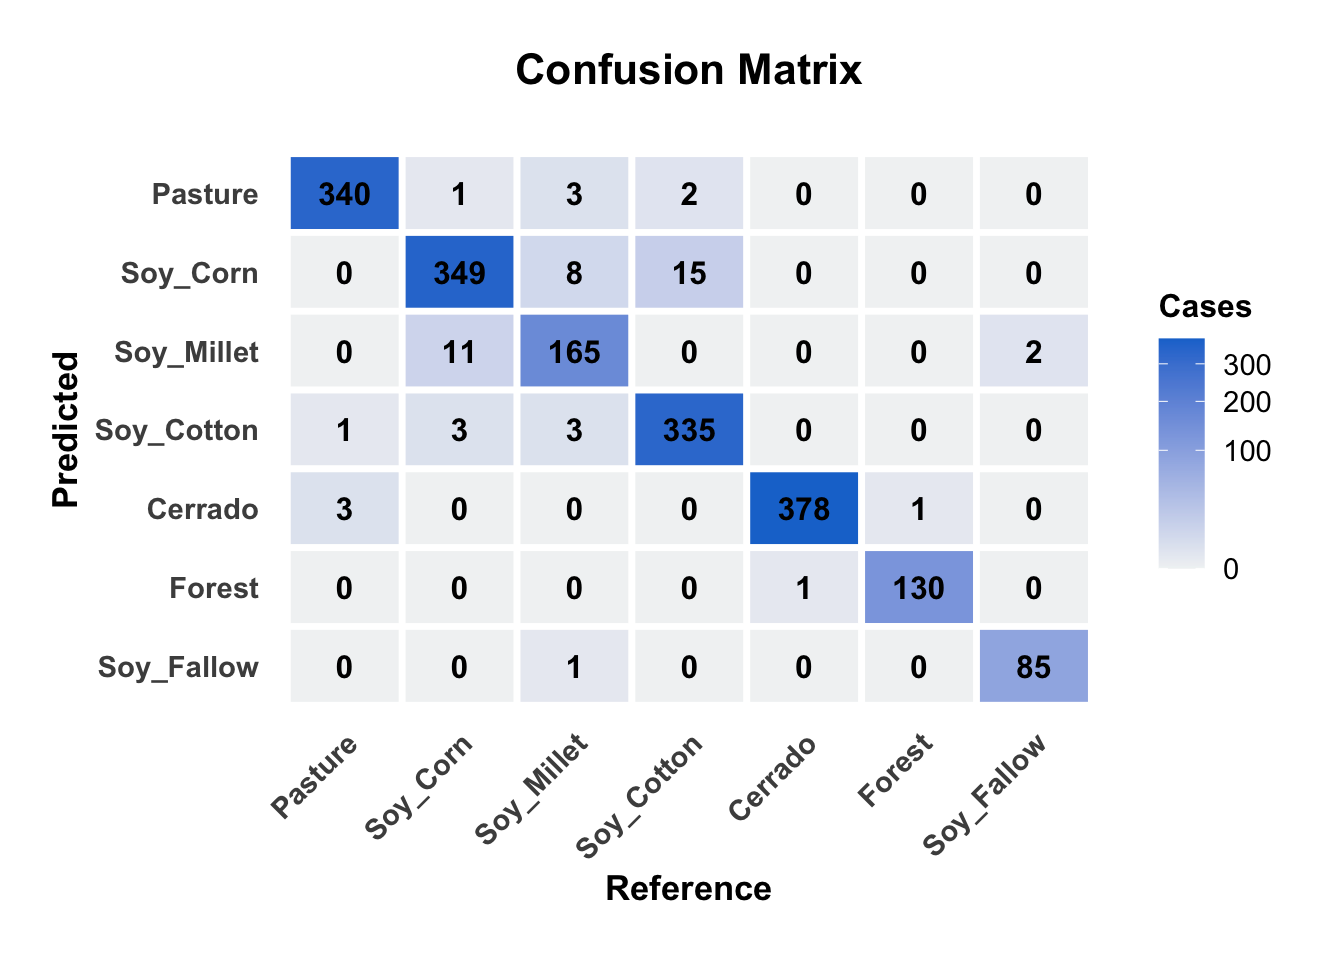
# Load samples
samples_matogrosso_mod13q1 = load_samples(
    name = "samples_matogrosso_mod13q1",
    package = "sitsdata"
)

rfor_validate_mt = sits_kfold_validate(
    samples = samples_matogrosso_mod13q1,
    folds = 5,
    ml_method = sits_rfor(),
    multicores = 5
)
# plot the confusion matrix
plot(rfor_validate_mt, type_ = "confusion_matrix")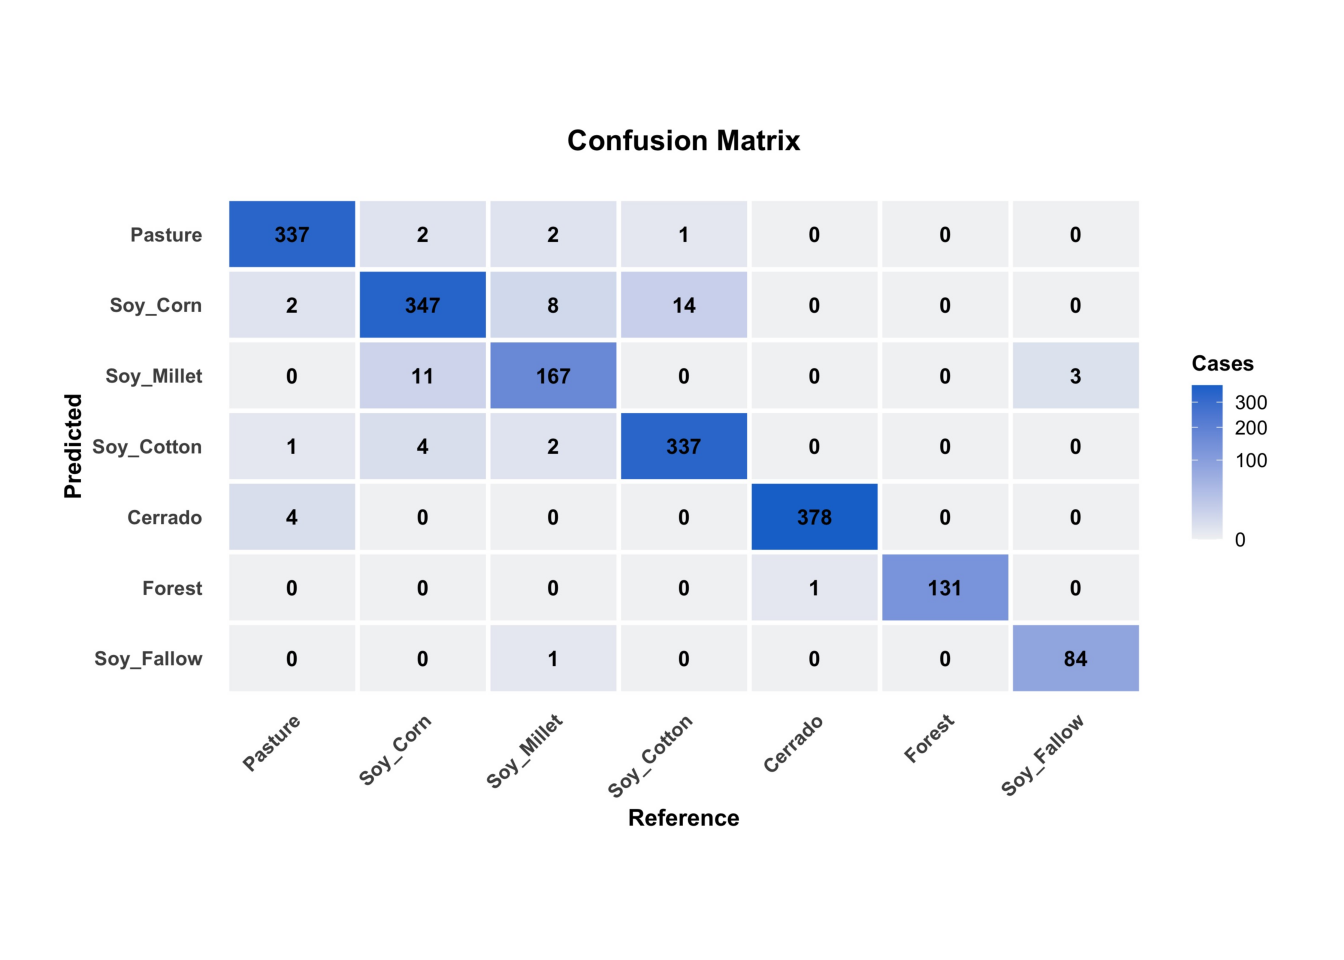
# Plot the metrics by class
plot(rfor_validate_mt, type = "metrics")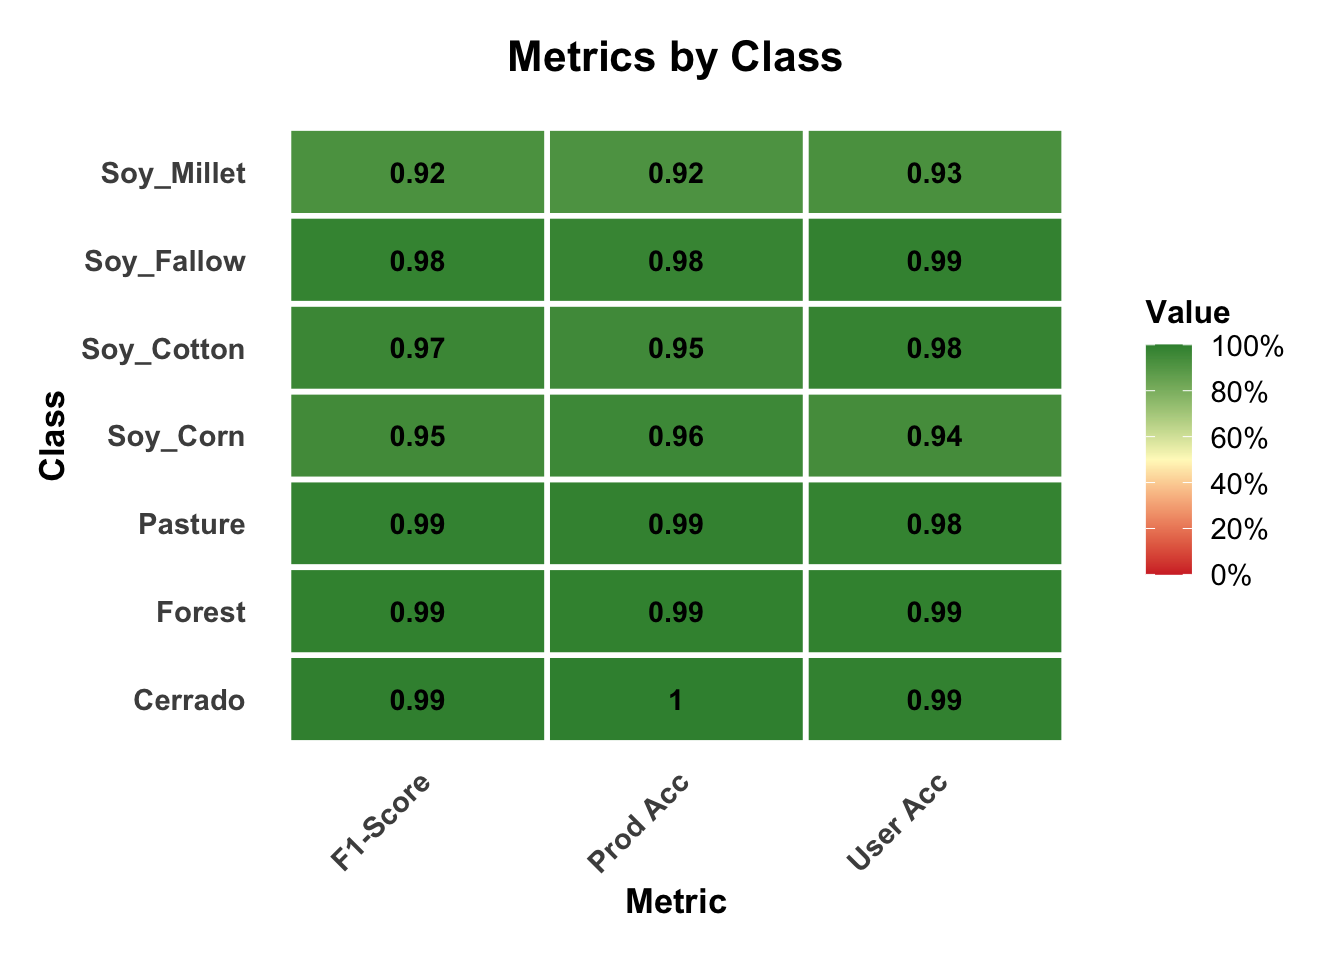
# Plot the metrics by class
plot(rfor_validate_mt, type_ = "metrics")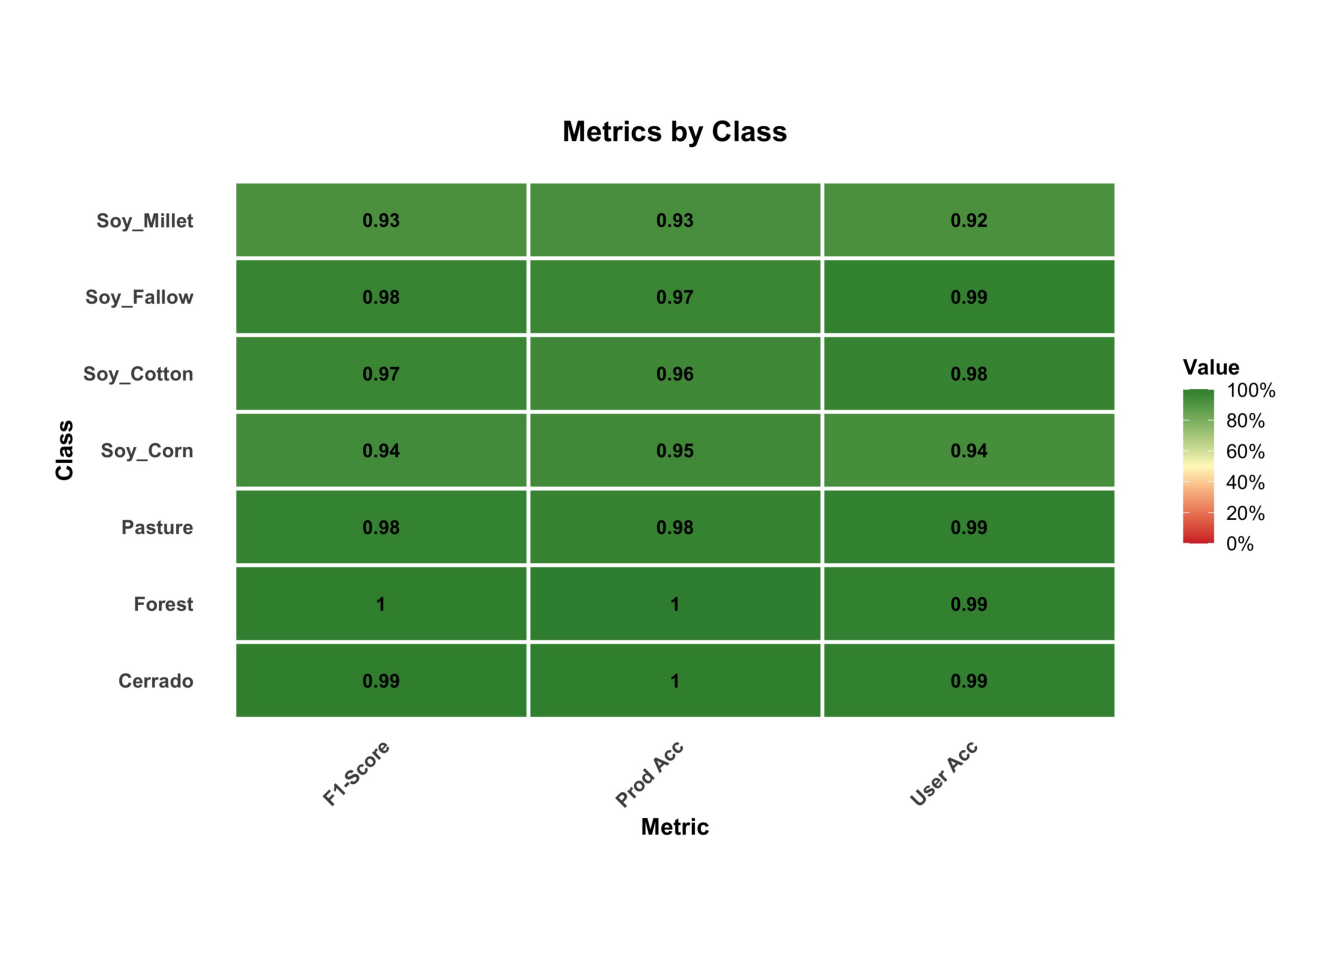
The results show a good validation, reaching 96% accuracy. However, this accuracy does not guarantee a good classification result. It only shows if the training data is internally consistent. In the next chapters, we present additional methods for measuring classification accuracy.
23.3 Summary
Cross-validation measures how well the model fits the training data. Using these results to measure classification accuracy is only valid if the training data is a good sample of the entire dataset. Training data is subject to various sources of bias. In land classification, some classes are much more frequent than others, so the training dataset will be imbalanced. Regional differences in soil and climate conditions for large areas will lead the same classes to have different spectral responses. Field analysts may be restricted to places they have access (e.g., along roads) when collecting samples. An additional problem is mixed pixels. Expert interpreters select samples that stand out in fieldwork or reference images. Border pixels are unlikely to be chosen as part of the training data. For all these reasons, cross-validation results do not measure classification accuracy.